Reasons Behind the Increasing Size, Weight, and Power of New Vehicles

View pictures in App save up to 80% data.
Fast Access
Vehicles getting larger and larger is a well-known phenomenon, with even modern small city cars being the size of family hatchbacks from 20 or 30 years ago. There are a multitude of reasons for this (mostly people want the latest to be bigger and better than the last), but there are other interesting trends that have gone hand in hand with the ever-increasing size of cars.
The United States Environmental Protection Agency recently unveiled some fascinating research into the trends in road cars across the past 50 years, which illustrates exactly how the industry has progressed during this period. CarBuzz decided to look into the data and work out why vehicles have trended in the way they have.
This article examines the data published by the EPA concerning the average changes in weight, size, power, and fuel efficiency of new vehicles over the last five decades. The information utilized in this piece has been gathered from reputable sources, including industry research organizations.
Economic Growth and Power Have Increased in Tandem
How Average Power, Weight, and Efficiency Metrics Have Evolved Since 1975
Year |
1975 |
1985 |
1995 |
2005 |
2015 |
2025 |
|---|---|---|---|---|---|---|
Power |
0% |
-20% |
12.5% |
55% |
68% |
90% |
Fuel Efficiency |
0% |
60% |
55% |
50% |
87.5% |
110% |
Weight |
0% |
-20% |
-10% |
0% |
0% |
10% |
The most eye-opening stat made clear by the EPAs data is that cars are over 100% more fuel efficient in 2025 than they were back in 1975, showing just how far engine technology has come since then. The average level of power produced by vehicles has increased by nearly as much, with current cars in the USA making around 95% more grunt on average than they did back in 1975.
During this period, the US government made a commitment to reducing vehicle emissions, leading to the implementation of laws that required manufacturers to limit engine power in order to decrease greenhouse gas output. As a result, engine power was notably diminished compared to the 1960s, although emissions did see a positive decline. This impact is reflected in the EPA's chart, which shows that fuel efficiency skyrocketed by approximately 60% within just five years, reaching 1980. Conversely, vehicle power saw a decline, with cars outputting about 25% less power by that same year.
From that point on, average power figures started a consistent uptick in form, rising from -25% to the current 95%. Fuel efficiency did the same, other than a brief drop in the late 1980s and 1990s. The average weight of vehicles also increased in parallel to these two aspects, but to a much smaller extent. Cars were around 20% lighter in 1980 than they had been five years earlier, though they have steadily been growing in mass since. As of 2025, cars are around 10% heavier than they were in 1975.
The Surge of SUVs Impacted the Drive for Fuel Efficiency
View pictures in App save up to 80% data.
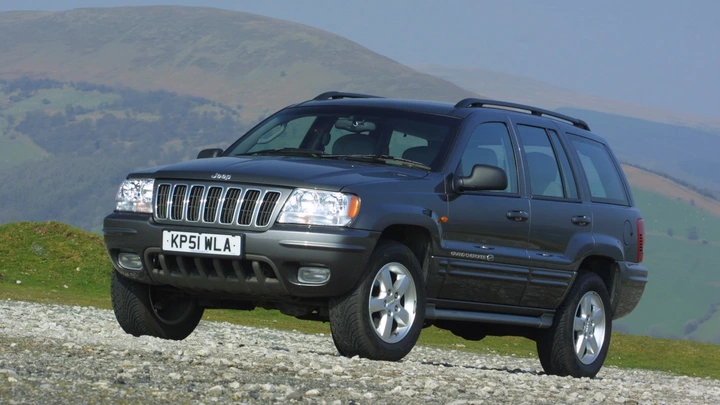
The drop in fuel efficiency during the late 1980s and 1990s, which saw the average go from 70% in 1985 to just under 50% by 2005, was largely due to the rise of the SUV. To move a big hunk of metal, you need a big engine.
The introduction of more efficient engines, including hybrids, in the mid-2000s has shifted the focus back towards improved fuel economy, which now stands at 110% compared to levels from 1975.
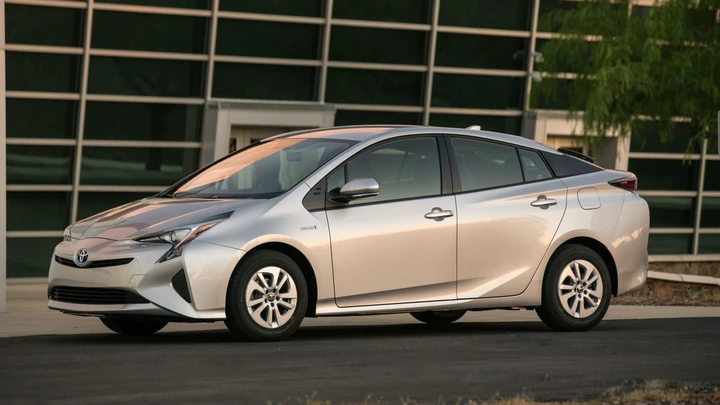
View pictures in App save up to 80% data.
With a budget of $10,000 for a car, the top choices for fuel efficiency would be the Toyota Prius